Dies ist die Support Website des Buches:
Das Python Praxisbuch
Der große Profi-Leitfaden für Programmierer
Farid Hajji
Addison Wesley / Pearson Education
ISBN 978-3-8273-2543-3 (Sep 2008), 1298 Seiten.
17. Python für Wissenschaftler
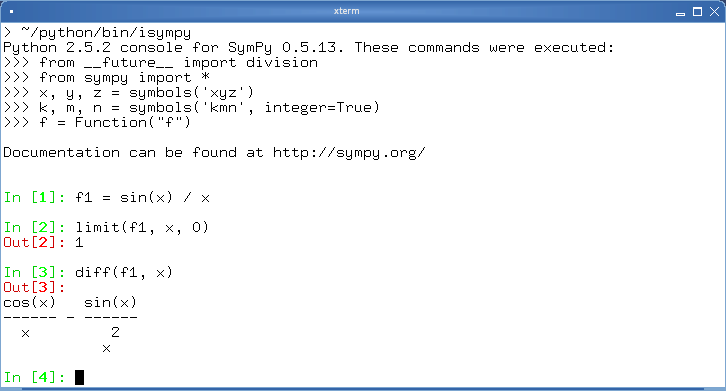
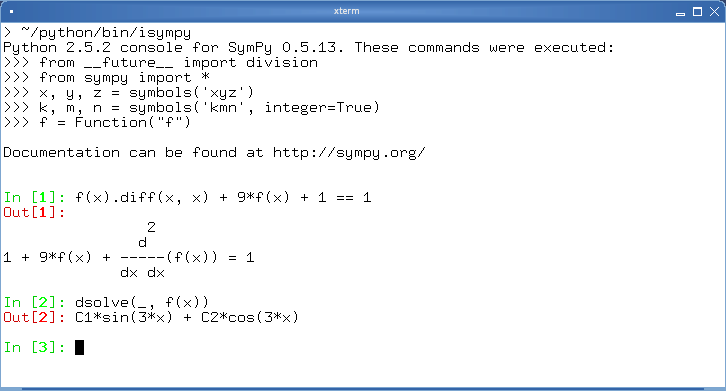
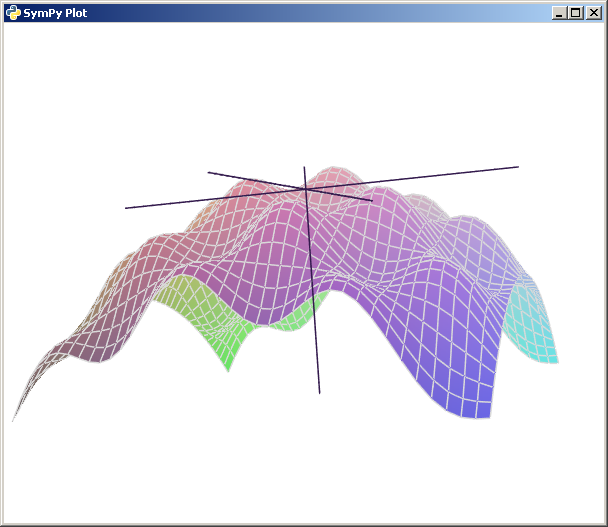
Das Computer Algebra System sympy
Screenshots:
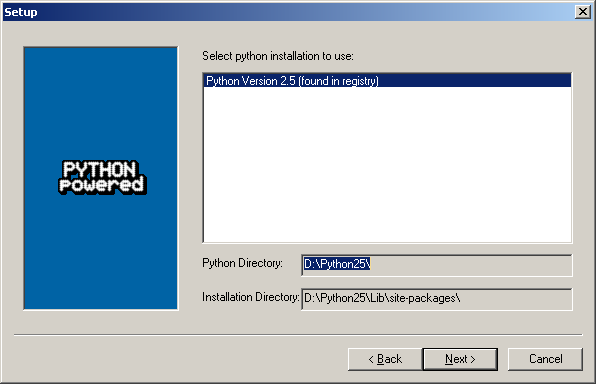
sympy installieren
URLs:
- Die Sympy Website (aber mit
easy_install sympyinstallieren)
Die Datentypen Rational, Real und Integer
Ein paar Konstanten
Ausdrücke
Reihen
Pattern Matching
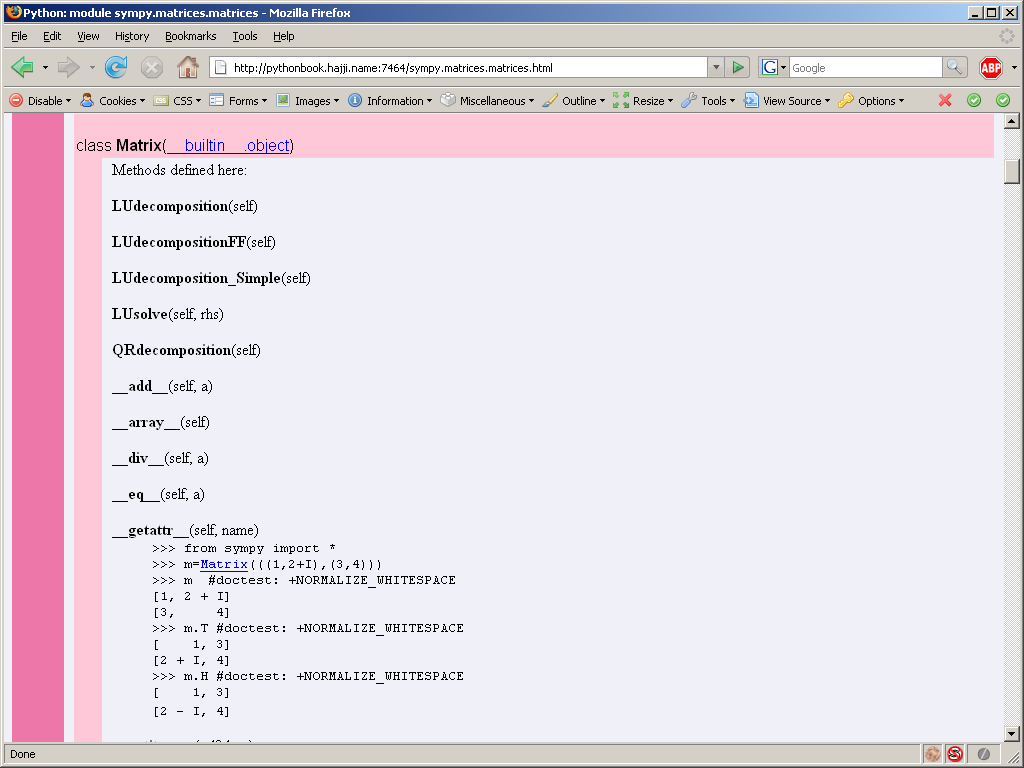
Lineare Algebra
Matrizen erzeugen
Matrizenoperationen
Screenshots:
Die Funktion CreateMatrix:
def createMatrix(rank):
    "Create a rank x rank matrix full of symbols"
    varlist = []
    for i in range(rank):
        for j in range(rank):
            varlist.append(Symbol("x%d%d" % (i+1,j+1)))
    return Matrix(rank, rank, varlist)
Anwendung: Lösung linearer Gleichungen
Anwendung: Eigenwerte und Eigenvektoren
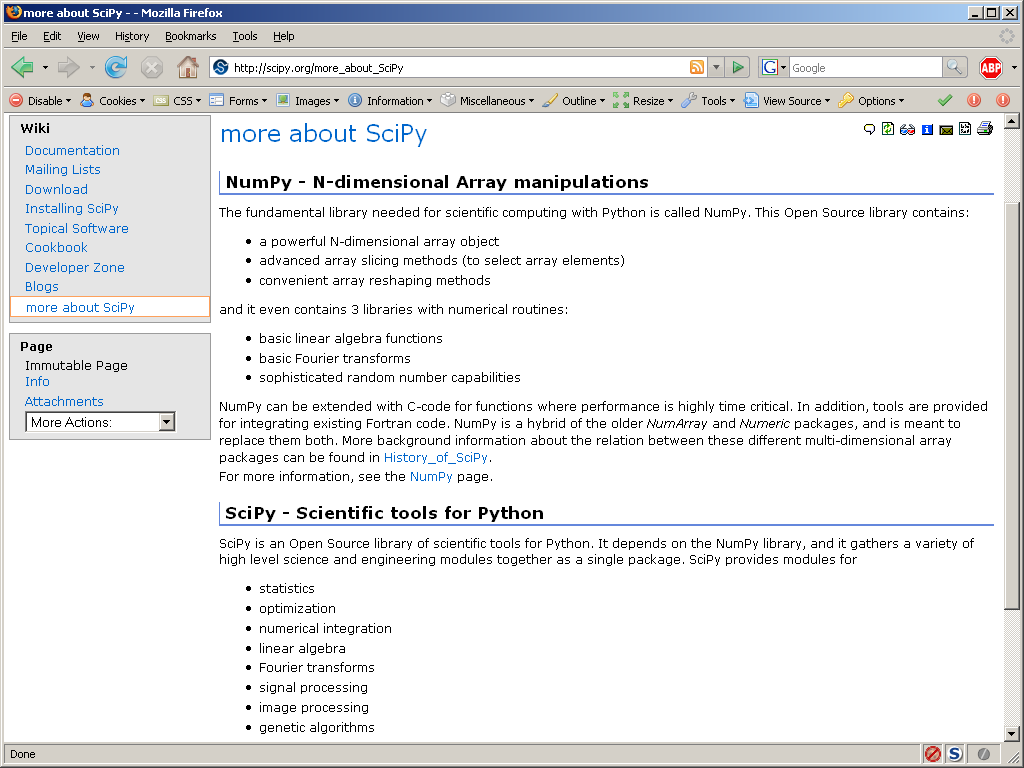
Effiziente numerische Berechnungen mit numpy und scipy
Screenshots:
URLS:
- Die Scipy Homepage
- Basic Linear Algebra Library (BLAS)
- Automatically Tuned Linear Algebra Software (ATLAS)
numpy
numpy unter Unix installieren
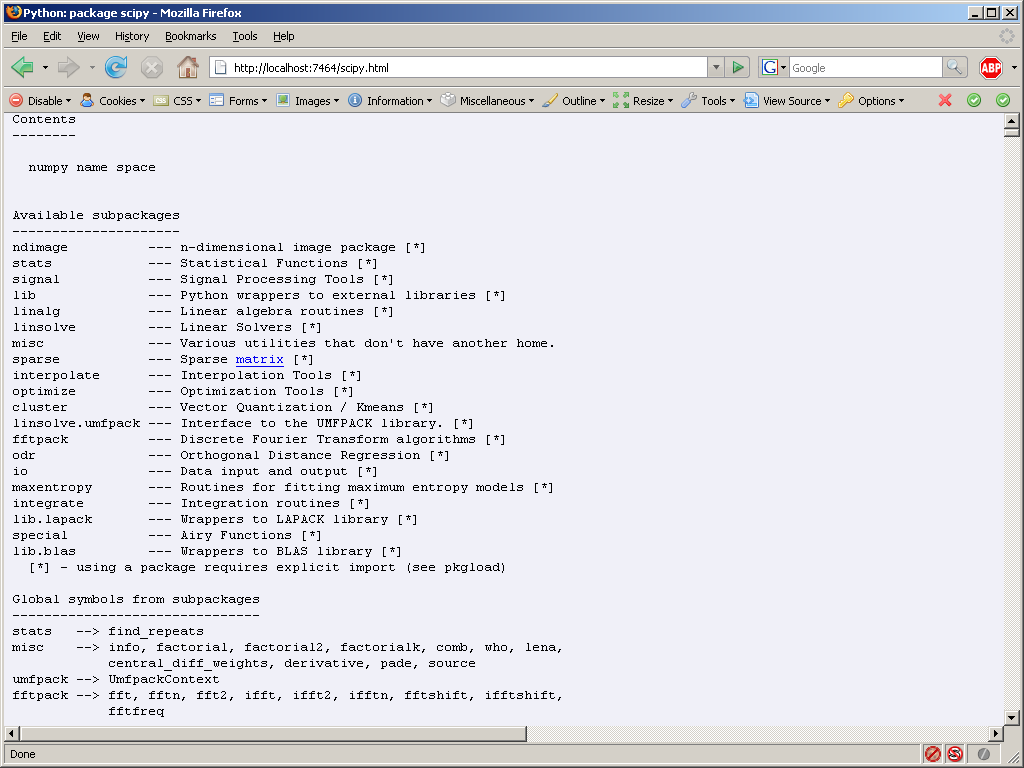
Wie finde ich mich in numpy zurecht?
#!/usr/bin/env python
# introspectme.py -- helper functions to inspect large modules

import inspect

def modules(module):
    "Returns a list of submodules of module"
    return [m[0] for m in inspect.getmembers(module)
            if inspect.ismodule(m[1]) ]

def functions(module):
    "Returns a list of functions of module"
    return [m[0] for m in inspect.getmembers(module)
            if inspect.isfunction(m[1])]
Der array-Datentyp aus numpy
Gleichungssysteme lösen
Nullstellen eines Polynoms
Fourier-Transformationen
Lineare Algebra
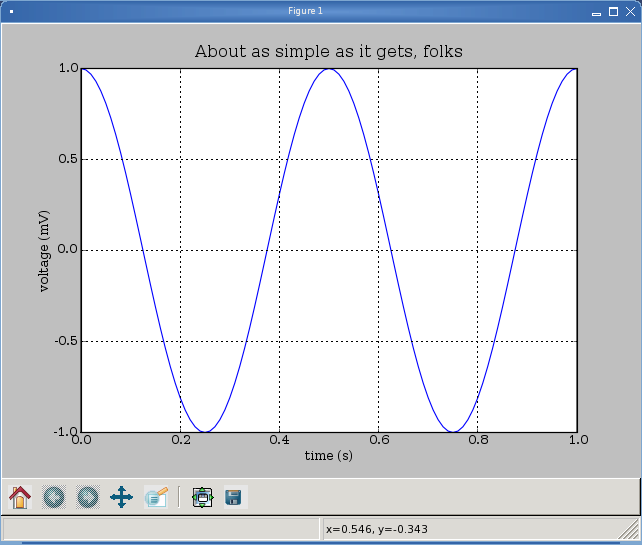
Plotten mit pylab (a.k.a. matplotlib)
URLs:
#!/usr/bin/env python
"""
Example: simple line plot.
Show how to make and save a simple line plot with labels, title and grid
"""
import numpy
import pylab

t = numpy.arange(0.0, 1.0+0.01, 0.01)
s = numpy.cos(2*2*numpy.pi*t)
pylab.plot(t, s)

pylab.xlabel('time (s)')
pylab.ylabel('voltage (mV)')
pylab.title('About as simple as it gets, folks')
pylab.grid(True)
pylab.savefig('simple_plot')

pylab.show()
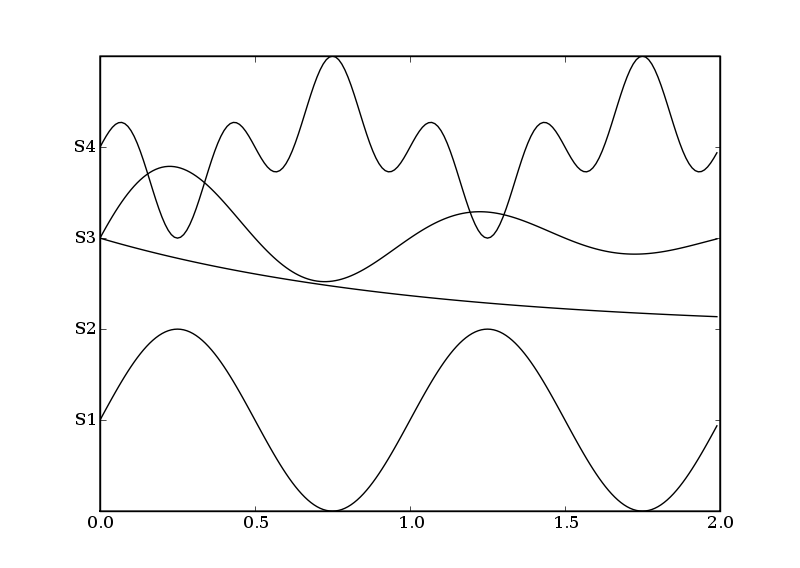
#!/usr/bin/env python
# From Matplotlib Cookbook

from pylab import plot, show, ylim, yticks
from matplotlib.numerix import sin, cos, exp, pi, arange

t = arange(0.0, 2.0, 0.01)
s1 = sin(2*pi*t)
s2 = exp(-t)
s3 = sin(2*pi*t)*exp(-t)
s4 = sin(2*pi*t)*cos(4*pi*t)

t = arange(0.0, 2.0, 0.01)
plot(t, s1, t, s2+1, t, s3+2, t, s4+3, color='k')
ylim(-1,4)
yticks(arange(4), ['S1', 'S2', 'S3', 'S4'])

show()
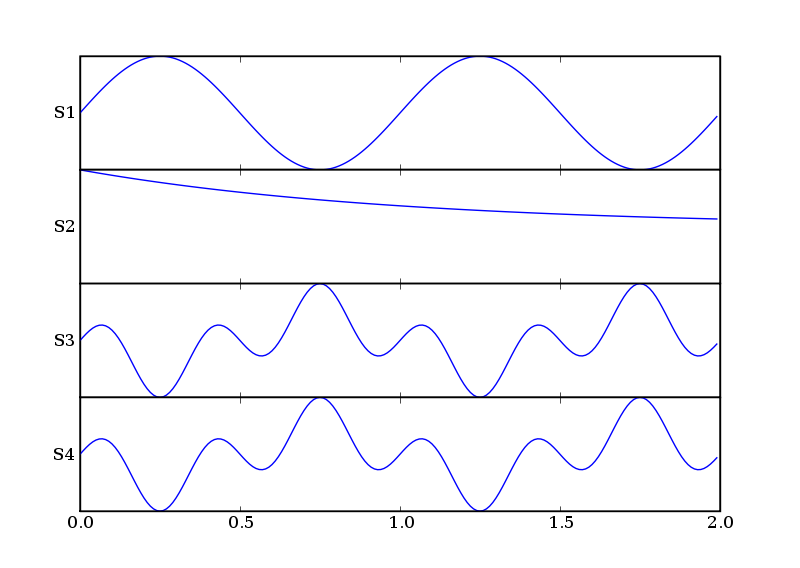
#!/usr/bin/env python
# From Matplotlib Cookbook

from pylab import figure, show, setp
from matplotlib.numerix import sin, cos, exp, pi, arange

t = arange(0.0, 2.0, 0.01)
s1 = sin(2*pi*t)
s2 = exp(-t)
s3 = sin(2*pi*t)*exp(-t)
s4 = sin(2*pi*t)*cos(4*pi*t)

fig = figure()
t = arange(0.0, 2.0, 0.01)

yprops = dict(rotation=0,
              horizontalalignment='right',
              verticalalignment='center',
              x=-0.01)

axprops = dict(yticks=[])

ax1 =fig.add_axes([0.1, 0.7, 0.8, 0.2], **axprops)
ax1.plot(t, s1)
ax1.set_ylabel('S1', **yprops)

axprops['sharex'] = ax1
axprops['sharey'] = ax1

# force x axes to remain in register, even with toolbar navigation
ax2 = fig.add_axes([0.1, 0.5, 0.8, 0.2], **axprops)

ax2.plot(t, s2)
ax2.set_ylabel('S2', **yprops)

ax3 = fig.add_axes([0.1, 0.3, 0.8, 0.2], **axprops)
ax3.plot(t, s4)
ax3.set_ylabel('S3', **yprops)

ax4 = fig.add_axes([0.1, 0.1, 0.8, 0.2], **axprops)
ax4.plot(t, s4)
ax4.set_ylabel('S4', **yprops)

# turn off x ticklabels for all but the lower axes
for ax in ax1, ax2, ax3:
    setp(ax.get_xticklabels(), visible=False)

show()
Screenshots: